
 This project was a lab learning tool for teaching concepts found in a sensors and transducers class.
It was developed (with COVID in mind) as a way for students to remotely connect to one of three lab stands
and physically interact with the lab setup using a MATLAB Simulink interface.
Webcam streaming allowed students to monitor the experiments and real-time data was directly read and plotted from various sensors such as thermistors, photoresistors, force sensors, and more.
This project was a lab learning tool for teaching concepts found in a sensors and transducers class.
It was developed (with COVID in mind) as a way for students to remotely connect to one of three lab stands
and physically interact with the lab setup using a MATLAB Simulink interface.
Webcam streaming allowed students to monitor the experiments and real-time data was directly read and plotted from various sensors such as thermistors, photoresistors, force sensors, and more.
I contributed heavily to the design, construction, and performed all coding of the Arduinos, Simulink labs, start up application, and web server of this lab setup. This was during my time working under Dr. Mark Trudgen at the University of Georgia. This project was submitted to ASEE as a conference publication which can be found here: https://peer.asee.org/byoe-fabrication-implementation-and-design-of-a-remote-lab-setup-for-a-sensors-and-transducers-course.
Functionality Overview
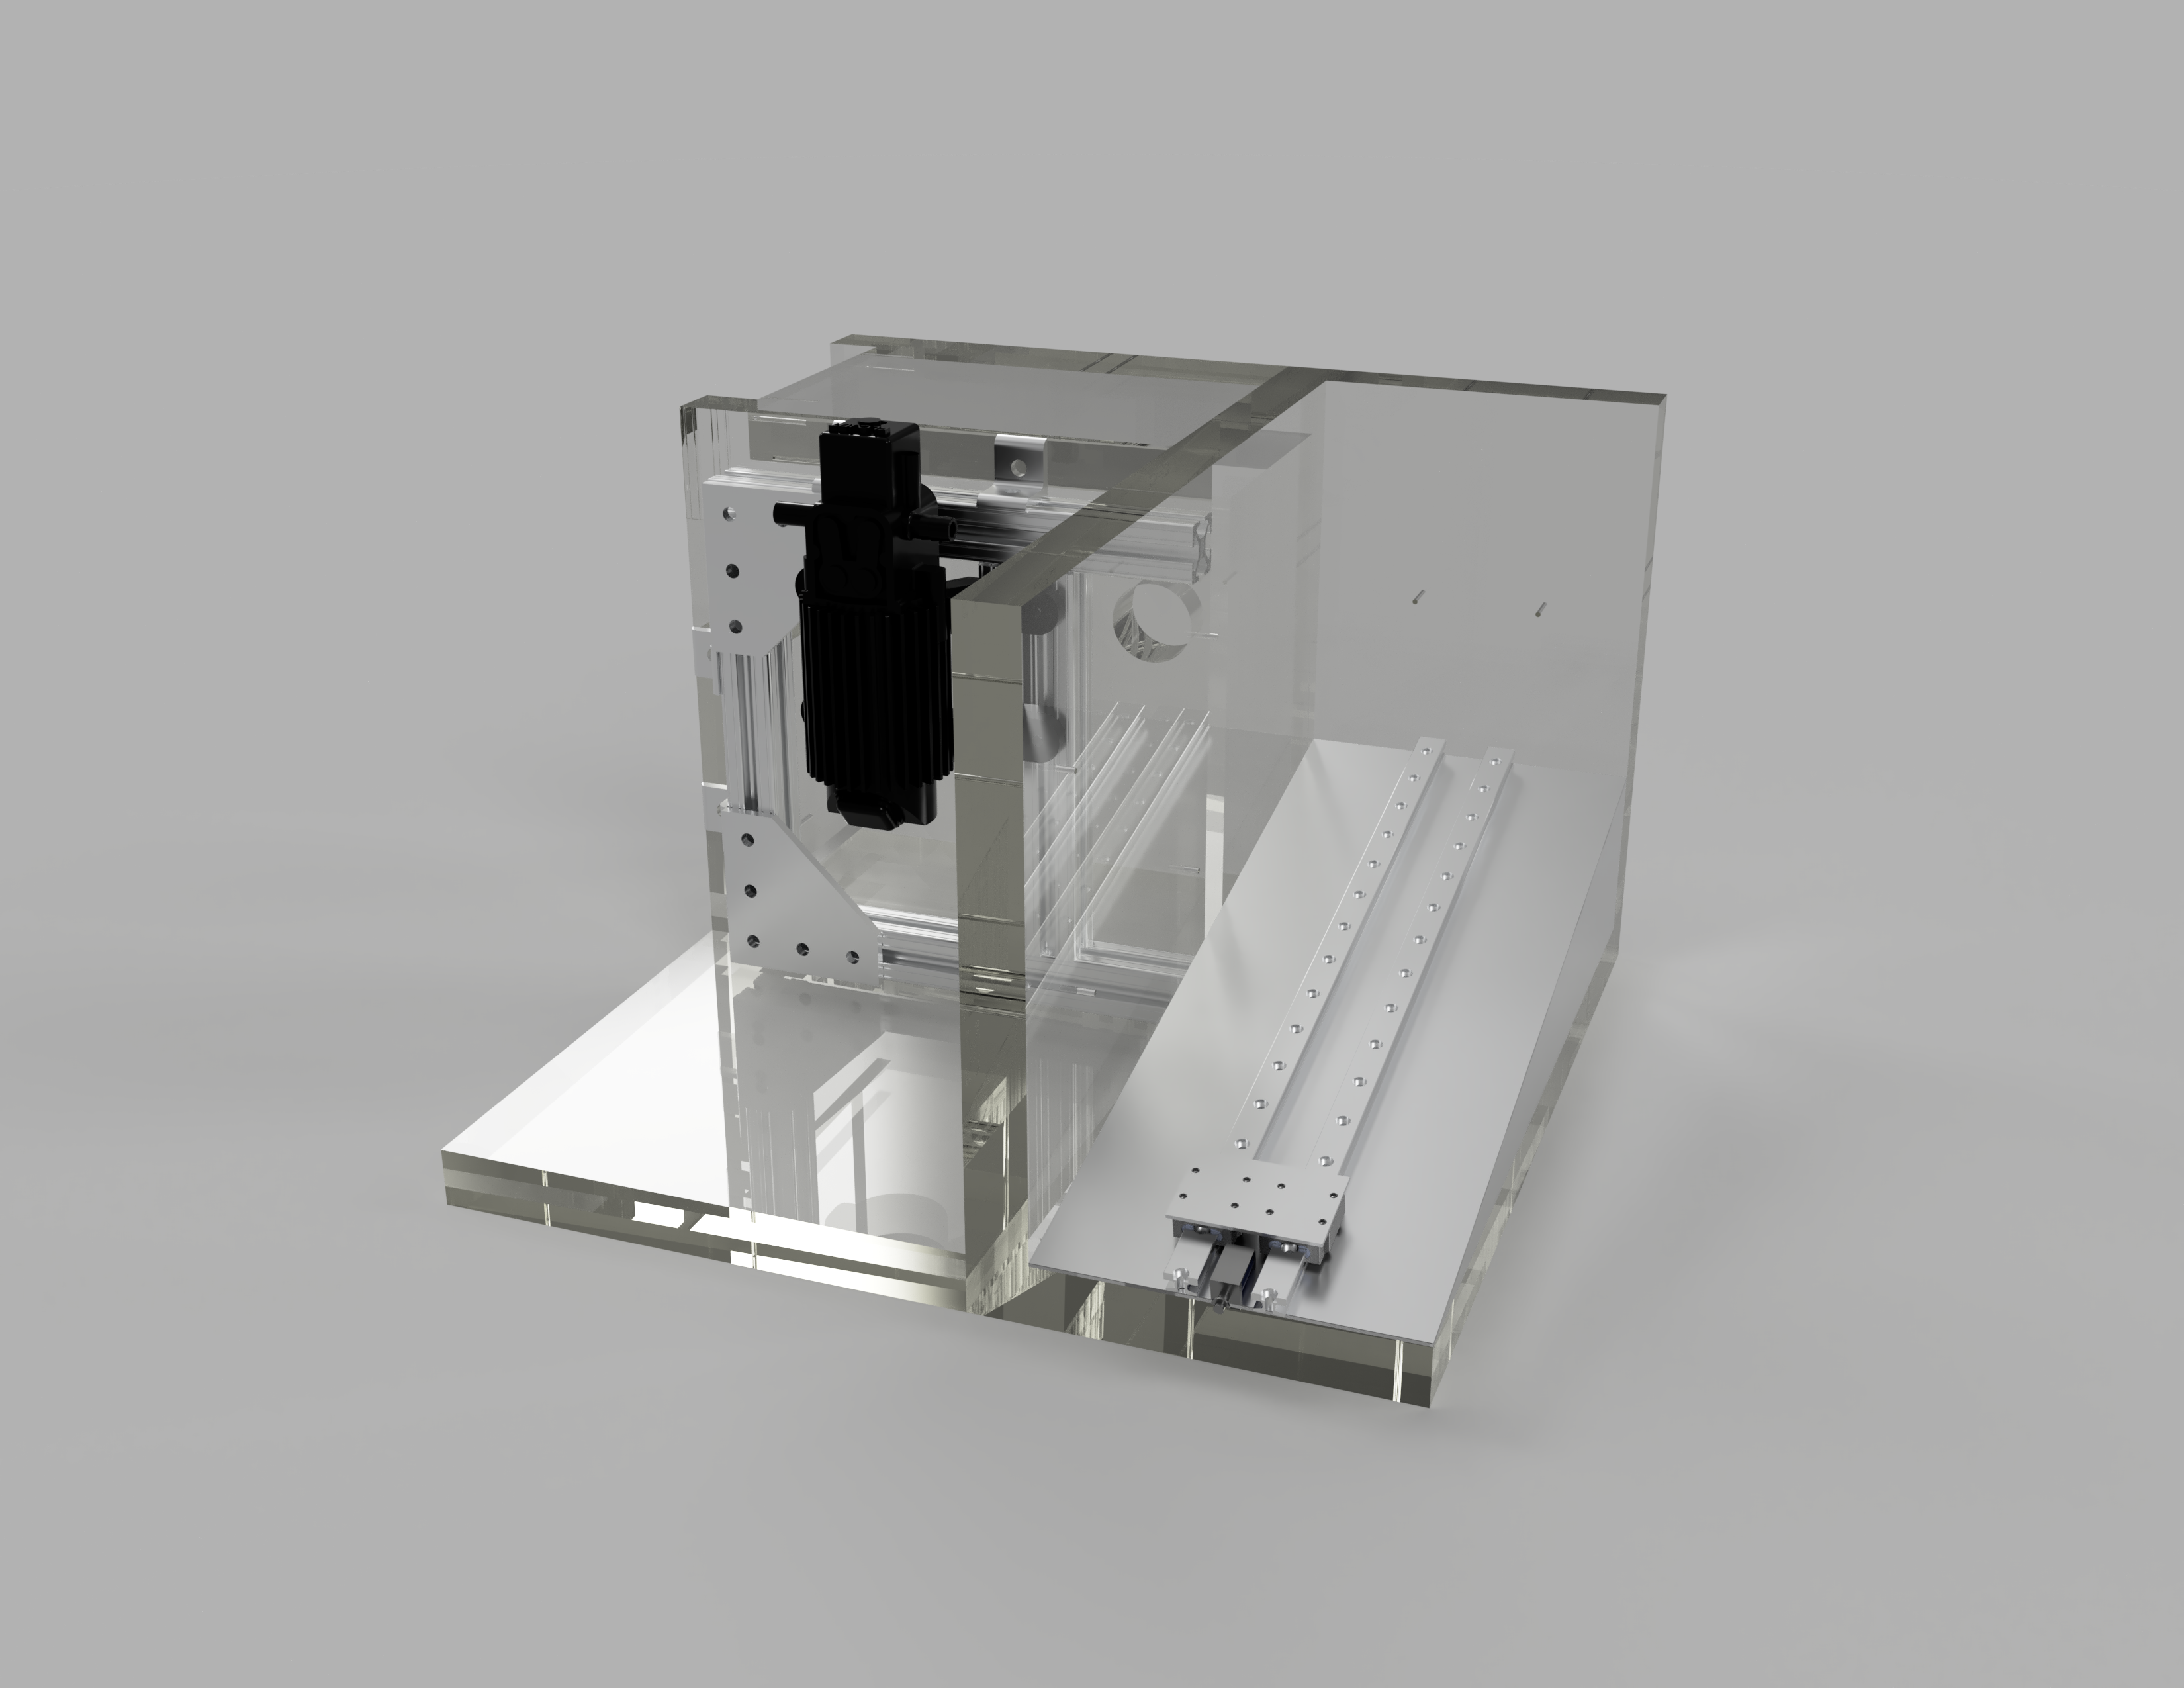
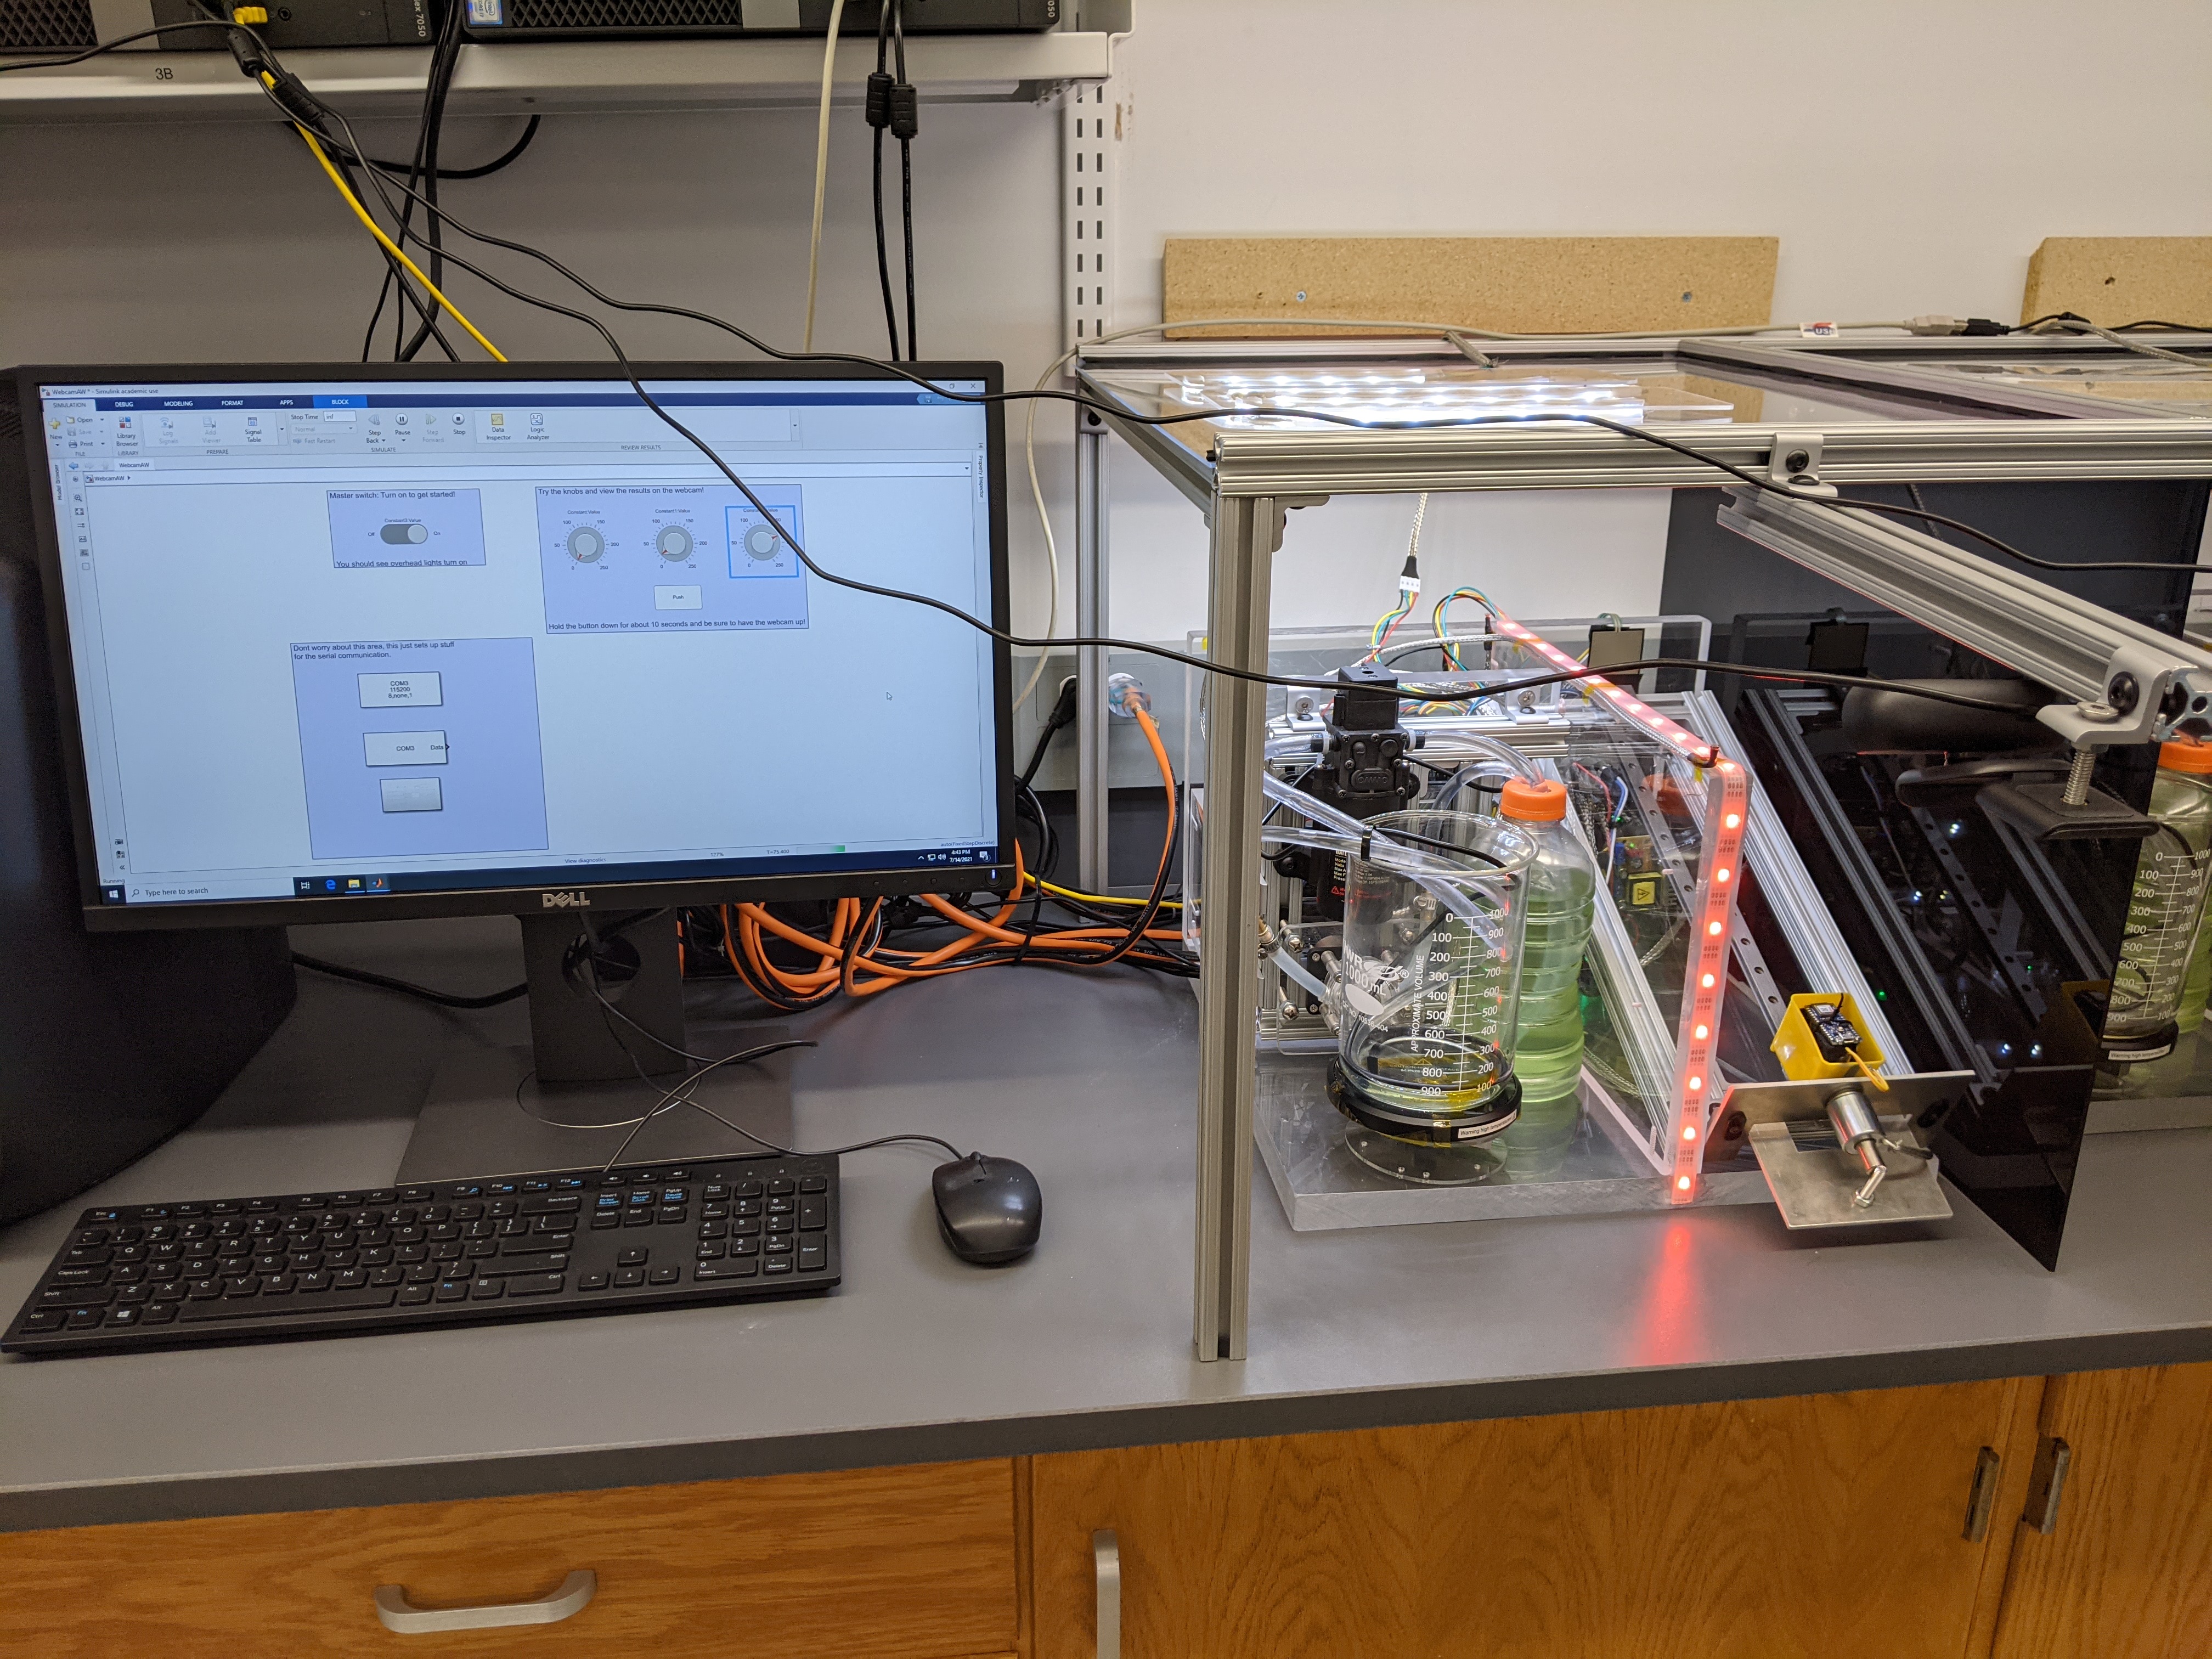
The primary goal in the creation of the stands was to create physical visual labs that can be virtually accessed through a VNC type connection. It can be seen in figure 1 the computer interface the user will see (via Simulink), and the webcam set up. Users log into the stands and can access the Simulink and webcam to control the labs and collect data in real time.
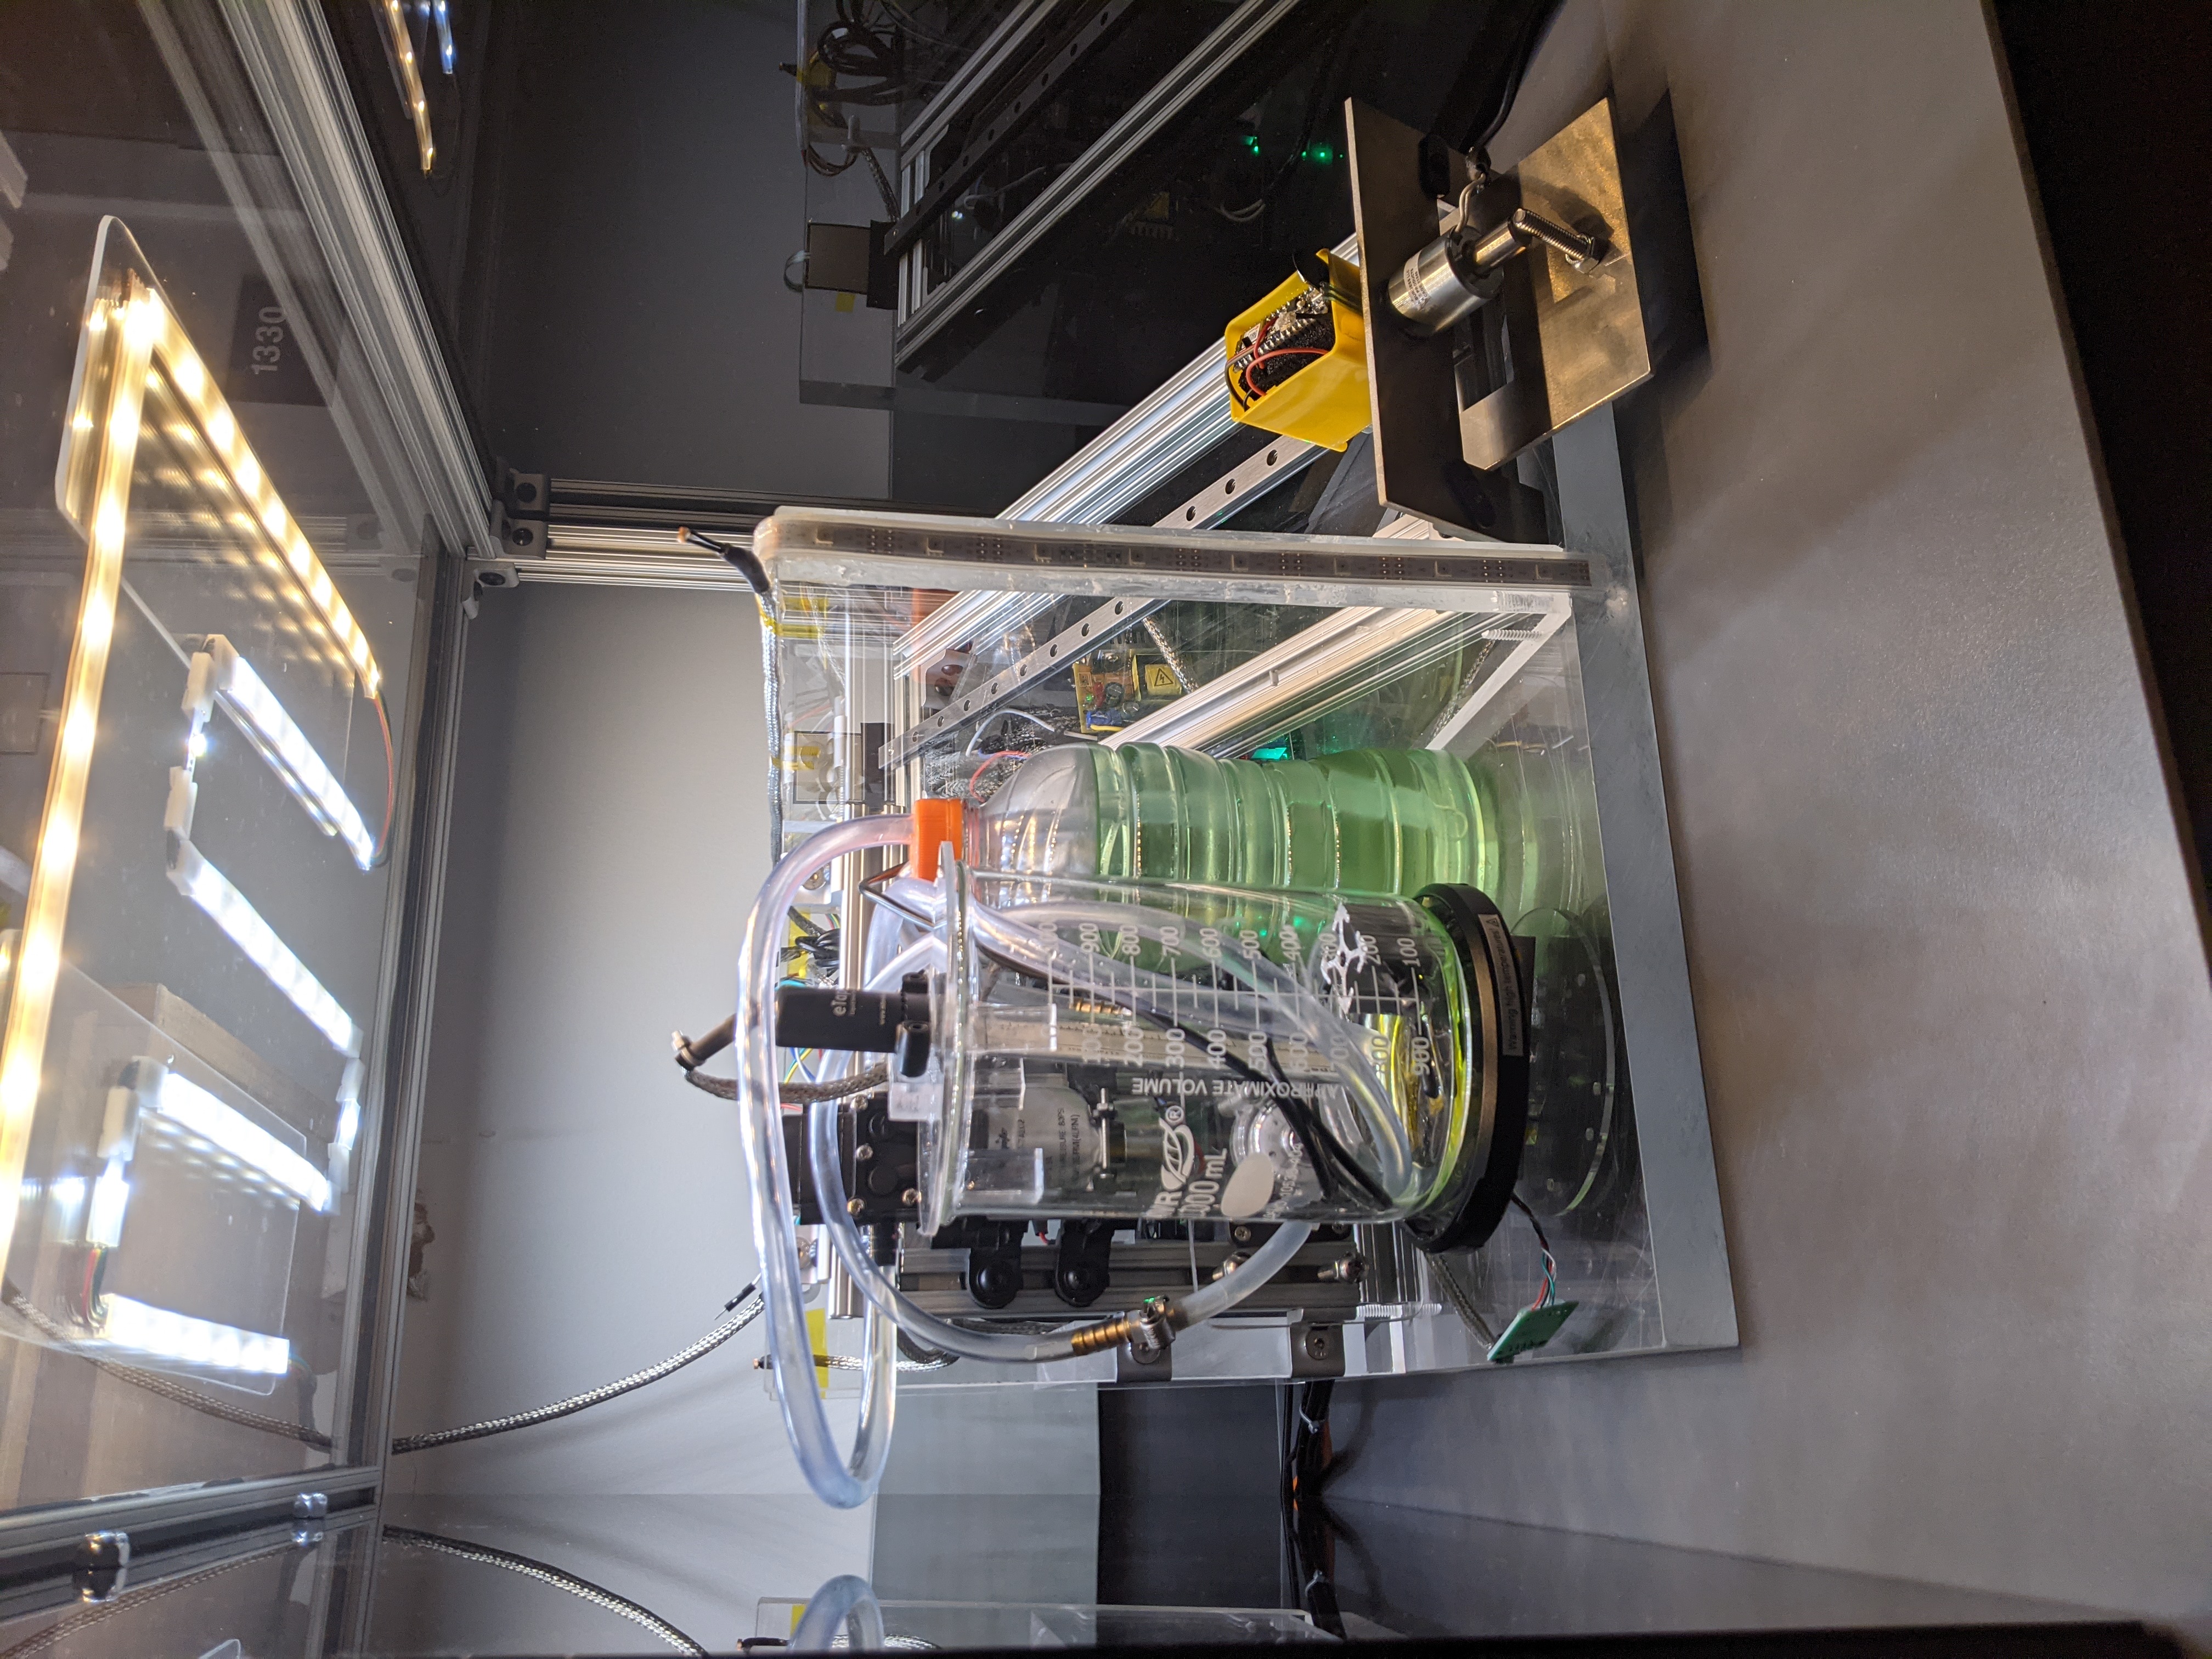
The stands have two main sections, split between left and right halves. On the left half, the various features include two water pumps for bidirectional pumping of liquid out of the water bottle. The water gets pumped in and out of a beaker that sits upon a heating pad. This allows a setup for various sensors such as temperature sensors, water height sensors, and a weight sensor. The right half contains the mine cart setup, which contains a solenoid that shoots off the mine cart up the track. This setup contains force sensors at the solenoid and at the end of the track. Within the minecart lies another arduino that has built in acceleration and gyroscope sensors for further data collection. This communicates to the main setup via bluetooth. These features can be seen below in figure 2.
Looking at the layout of the electronics, different components are laid out on different levels. Level one or the bottom level contains the power supply that powers everything excluding Arduinos which receive power from their USB or power cables. Directly on top of the power supply, there are two solid state relays (SSRs) daisy chained together. One of these turns the power supply on and off, and the other turns on and off the heating element on the beaker. If the power supply is not turned on, the power to the heating element should also be cut off and thus the reason for daisy chaining. These SSRs are controlled via the master Arduino. Next to the SSRs is what is referred to as the passthrough Arduino. When students access the computers via VNC connection, they only have access to the passthrough Arduino. This makes it impossible for them to modify any of the code on the master arduino. See the section on communication for further clarification. Finally, a sensor for measuring input current is included. See figure 3.
The next layer contains electronics for controlling the water pumps and the mine cart circuitry. Pictured on the left-hand side of figure 4 is a relay for controlling a capacitor charging circuit. The charging circuit used is a ZVS driver. This can provide 500 volts required for the capacitor voltage. Upon activating this relay, the charging circuit begins charging the capacitor. After the relay is shut off, the capacitor dumps the voltage into the solenoid to shoot off the mine cart. Another relay not pictured is attached to the capacitor to create this behavior.
On the right-hand side of figure 4 is a basic H-bridge for controlling the two water pumps. This unit is overkill since the pumps are not reversible and always operate at full speed. Two relays would suffice as a replacement component.
The final layer of the electronic stack is the upper most visible layer. This contains a power rail and Arduino stack. This stack contains the master Arduino with a custom fabricated PCB and I/O shield to plug in peripherals. This can be seen in figure 5.
PCB Design
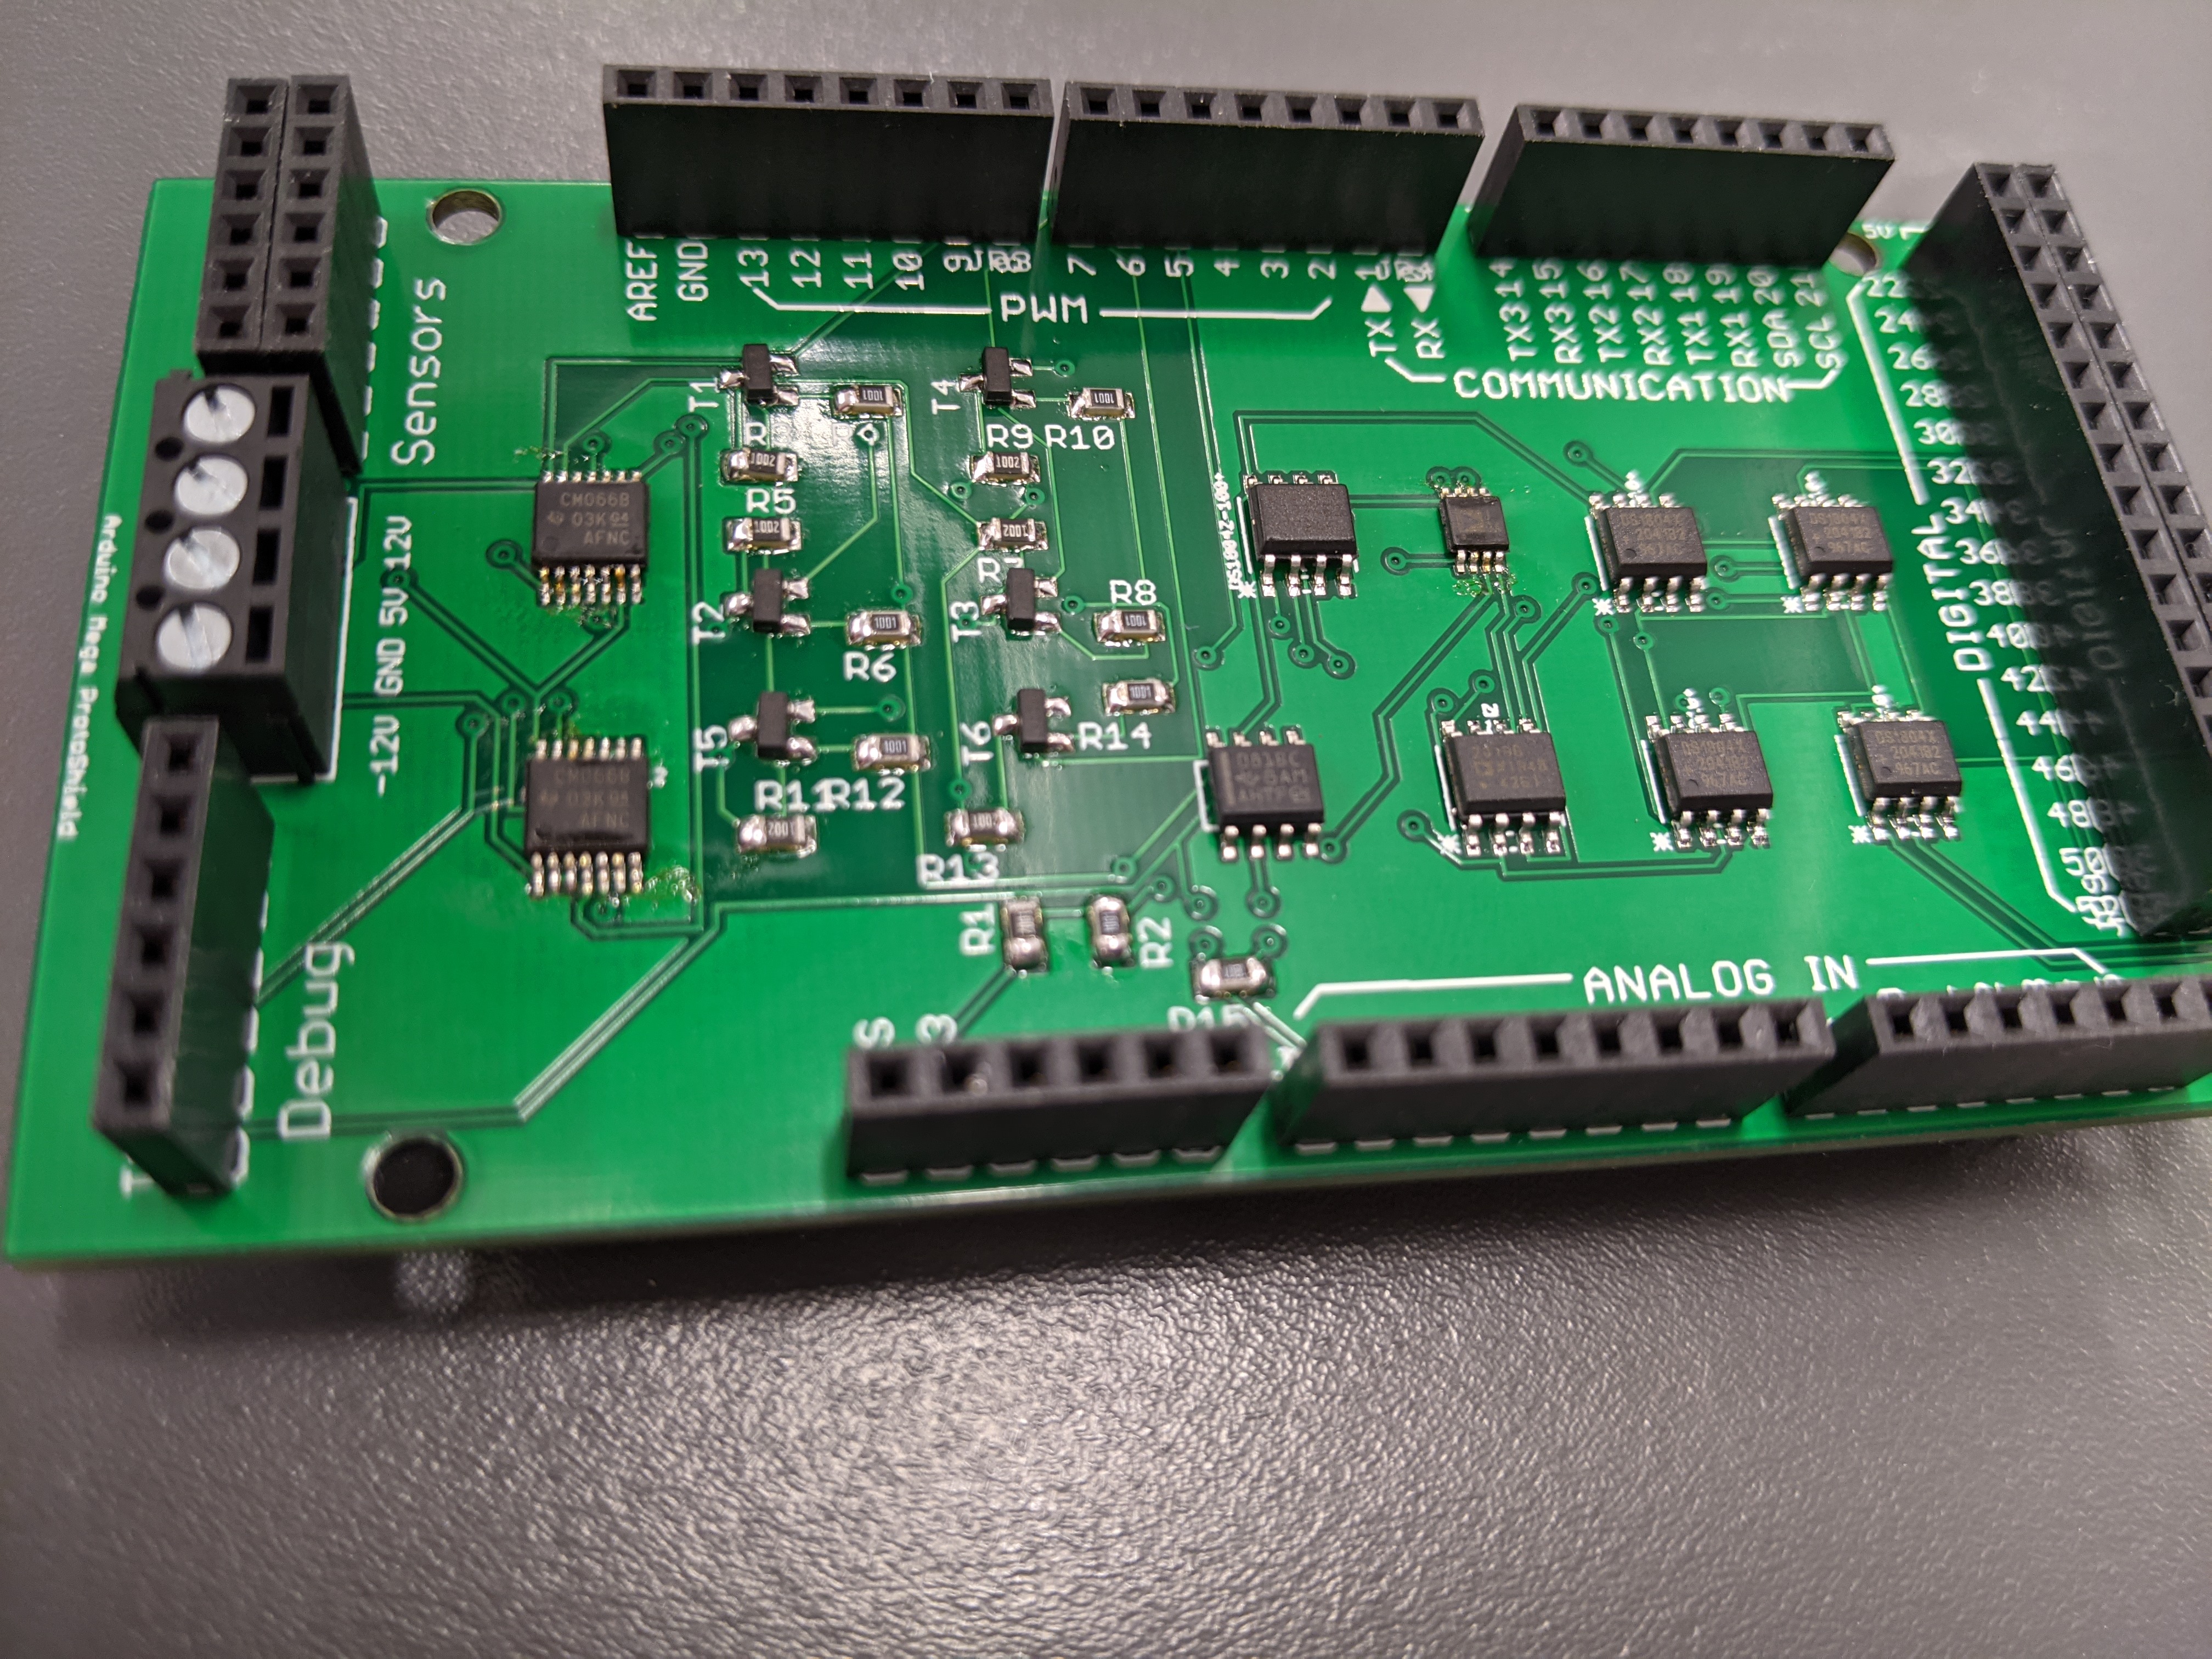
The manufactured PCB is pictured above. It was designed used Autocad EAGLE, and the schematic can be seen below:
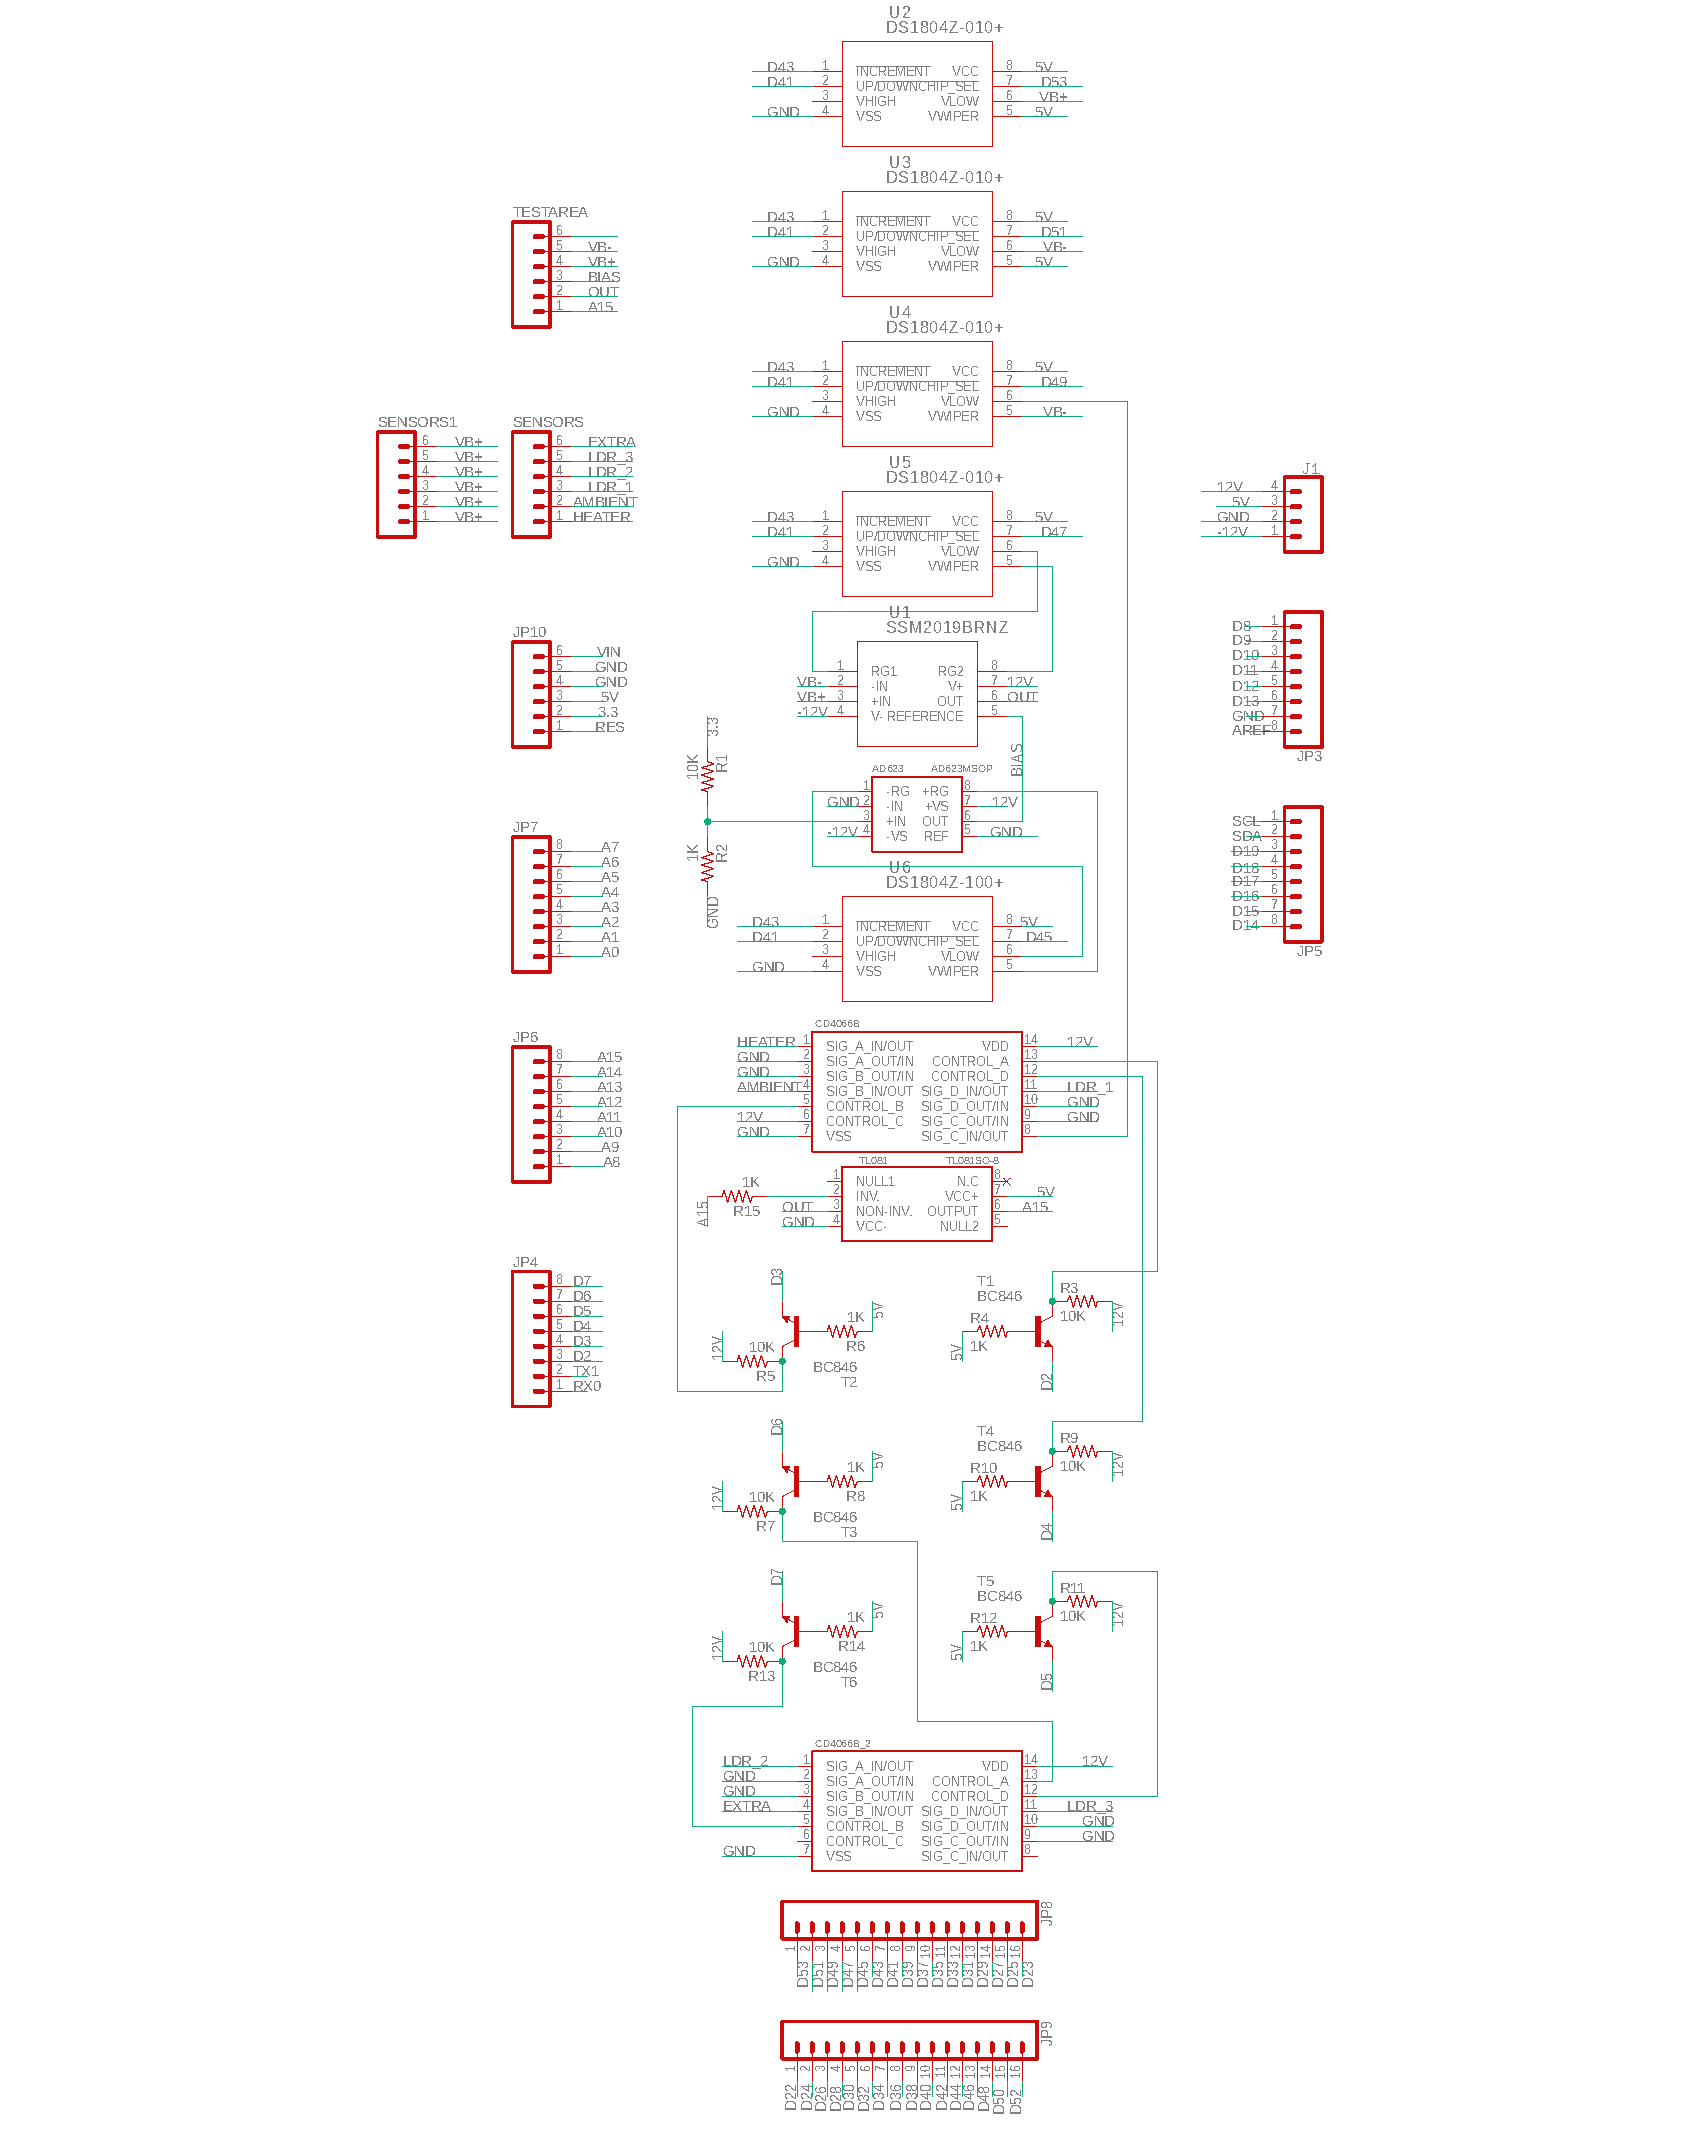
The stands were created with UGA's Sensors and Transducers class in mind. One key component in this class was creating a wheatstone bridge to maximize resistive sensors dynamic range. Therefore, the upper three digital potentiometers (DPOTS) are used as a programmable wheatstone bridge setup. The output of a wheatstone bridge setup often needs to be amplified and biased. The two in-amps take care of this, and two additional DPOTS are used to control the gain on the in-amps. In order to be able to use multiple resistive sensors at the same time, the switching ICs are used to multiplex between sensors. These switching ICs add a slight resistive element to the sensors they are placed in line with. To mitigate this undesirable effect, a 12-volt supply line is used to power the IC and provide switching control. This was chosen in accordance with the datasheet as it had the most linear resistive input and could be calculated out. As these ICs still needed to be controlled via the master Arduino, transistors were used as switches. The Arduino inputs 5 volts into the transistor, and the transistor then allows 12 volts to flow to the switching IC control pin.
Finally, a standard op-amp is used in follower configuration and powered with ground and 5 volts. This is a safety component to make sure the final output of the sensor setup is between 0 and 5 volts. This range was chosen in accordance with the analog input range of the Arduino as the output is inputted into an analog pin on the master Arduino.
Communication Diagram
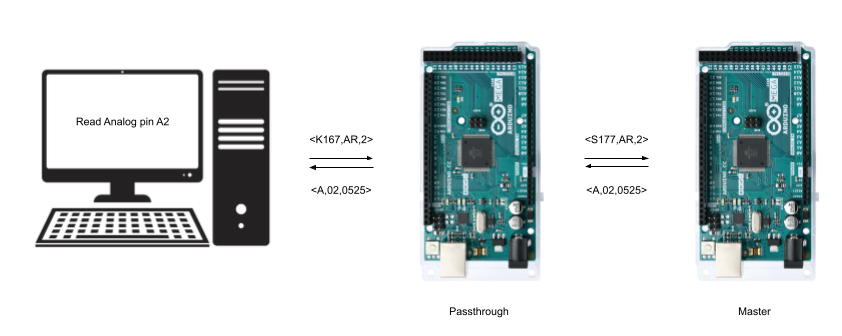
The communication breakdown is as follows. Users log into the computer via a VNC type login. This computer communicates with the passthrough arduino, as the master Arduino should not be physically connected to the computer. This enables all code on the master Arduino to remain untouchable by the user. Safety code is run on the master to watch various power usages and temperature sensors to make sure the appropriate precautions are in place on the physical lab stands. If a malicious user were to figure out the encoding sequence sent to the passthrough Arduino, the user still would not have control of the master Arduino as the passthrough Arduino's job is to change the encoded sequence. Therefore although the passthrough Arduino could be reprogrammed, there would be no way for the user to gain access to the master Arduino. Thus the reasoning behind the two system Arduino. The Arduino mega was chosen for its multi-serial output, thus the computer connects to the passthrough's primary serial, and is connected to the master via its secondary serial output. The code sent to the passthrough can be seen in the figure above and is then changed by the passthrough Arduino. The master decodes this and performs the proper action, i.e. read analog pin X. After reading the request, it sends back the corresponding response to the request.
The complete code can be found on my Github. Code includes safety measures such as monitoring the temperature of the beaker and the power usage of the lab stand. If any of these values exceed a certain threshold, the lab stand will automatically shut off. There is also code to automatically reset the stands after a certain amount of time, i.e. remove water from beakers.
Simulink
The code within simulink has two coded sublocks: the request block to control the stands or retrieve information and the parse block to present the returned information. The request block allows Simulink to pass information to a MATLAB function file within the working directory of the Simulink files. This file is labeled IP.m or IP.p. The IP.m file is a normal MATLAB function file, the IP.p file is obfuscated code. The labs presented to students should contain only the IP.p file. The IP.m file is edited by the lab instructor, and then converted into the IP.p file. Files can be obfuscated using pcode(filename). More information can be found here: https://www.mathworks.com/help/matlab/ref/pcode.html. The IP file returns a string which is then sent through the serial to the Arduino. Further information on how the Simulink code works with the stands and the labs created can be found on Github.
Monitoring/Logging Tool
The monitoring and logging tool monitors the computer activity, and if idle will automatically log the student off the system to allow other users to connect. The logging portion will upload data to Google Sheets and let the instructor know what student was logged into which station along with when and how long. The code is based on C# and runs the code at startup. Further information can be found on Github.
Website
The website was written in PHP and is very simplistic. The code simply opens a file and checks each computer's status. Images are updated according to the status found in the status.txt file located on the webserver. The file is updated via the monitoring/logging tool via the submit.php webpage. Further information can be found on Github.
Example Lab
The video below shows a basic overview of one of the first labs a student would do. This lab is the thermistor lab, and used after the student learned about properties of thermistors and wheatstone bridge setups. Keep in mind this video is based off of a very early prototype when electronics were still utilizing a breadboard, and the software was rudimentary. I did not show any circuit creation to not aid the student in any way, but in hindsight, I should have shown the Simulink toolbox with the various components available.